- QatarEnergy selects Nakilat to own and operate 25 conventional LNG vessels
- The joint development of the Dorra field between Saudi Arabia and Kuwait is pending the demarcation of the border with Iran
- Minister of Energy reaffirms the UAE’s commitment to adopting clean energy and supporting the Paris Agreement
- The new Hassi Messaoud refinery enjoys the support of the government and President Tebboune
- Increasing electrical interconnection capacities to export electricity beyond borders
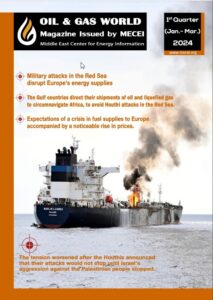
- Qatar Energy stops sending liquefied gas tankers through the Red Sea for security reasons
- The inauguration of the Duqm Refinery, the largest joint Gulf project in the refinery sector
- Saudi oil exports are faltering due to Houthi attacks on ships in the Red Sea and Gulf of Aden
- Algeria to host and chair the Gas Exporting Countries Forum summit (February 29 to March 2, 2024)
- Egypt Energy Conference and Exhibition 2024 gives a strong impetus to the global energy dialogue
table
| Energy Resources | 2010 | |
| MTOE | % | |
| 1 | 559 | 5484 |
| 2 | ||
| 3 | ||
| 4 | ||
| 5 | ||
| 6 | ||
| 7 | ||
| Source: BP Statistical Review of World Energy | ||
| World Countries | 2011 | 2012 |
| Actual | Forecasts | |
| OECD | ||
| Total World Consumption | 87.90 |
88.96 |
|
Source: Energy Information Administration/Short-Term Energy Outlook – March 2012 |
||
| World Countries | 2011 | 2012 |
| (Actual ) | (Forecasts) | |
| Canada
Mexico North Sea (b) |
||
| Source: Energy Information Administration/Short-Term Energy Outlook – March 2012 | ||
| Years | Basket Price $/bbl |
|
* Estimates Source: OPEC Yearly Basket Price. |
|
| Rank | Field Name | Countries | Discovery Year | Range of URR [GB ] |
| 1 | ||||
| 2 | ||||
| 3 | ||||
| 4 | ||||
| 5 | ||||
| 6 | ||||
| 7 | ||||
| 8 | ||||
| 9 | ||||
| 10 | ||||
| Source: AAPG, OGJ, EIA | ||||
| Rank | Major Oil & Gas Companies | Crude Oil(MM B/D) | N. Gas(MMcf/d) |
| Source: Oil Daily, Profit Profile Supplements, various dates, and company earnings reports | |||
| (Billion Barrels) | Countries | Rank |
| 1 | ||
| 2 | ||
| 3 | ||
| 4 | ||
| 5 | ||
| 6 | ||
| 7 | ||
| 8 | ||
| 9 | ||
| 10 | ||
| Source: CIA World Fact book | ||